


Collect data and don't lose it
Simulations are not good enough to understand real situation. Take GLAMOS Walker, go to the field and make real testing. Send messages from different locations to understand more about network coverage and signal quality. Walker allows you to make testing on different ways, with different LoRaWAN parameters.
The most advanced LoRaWAN testing device on the market is GLAMOS Walker (comparison table here) and that is reason why we recommend it.
But you can integrate other testing devices and GPS trackers to Walk App. E.g. RAK Field Tester, Wio Terminal, Adeunis Field Tester, TTGO T-Beam…
Testing device (Walker) will send messages wirelessly, gateway will forward it to LoRaWAN server and you can collect data in GLAMOS Walk App.
Forward data from your LoRaWAN server to the Walk App with HTTP POST integration.
You can make integration from ANY LoRaWAN server: Helium, The Things Network, Loriot, Actility, Senet, Chirpstack, Kerlink, Multitech, Kore, X-Telia.
If you are using other server, just contact us


Visualize and analyze your LoRaWAN network and speed up IoT deployment


Value is in the testing location
Walk App Map creates visualization of your network on geography map.
Know locations where you did successful or failed testings and how that locations are positioned in relation to the gateways.
Click on measuring point and get lines to every gateway you reached from that location.
Pop-up box will show you list of gateway names, signal quality (RSSI and SNR), distance between testing location and gateway location, SF, used antenna and time of testing.
Don’t fail with gateway deployment – that can cost a lost
Click on blue rectangle (gateway) and you will see lines to every measuring point from which that gateway was communicated. This will allow you to understand how good is position of specific gateway and is there some area that is not covered with network.
Don’t be blind
Blind spots are locations where you don’t have any communication between GLAMOS Walker or sensor device and gateways.
On example in photo, you can see that communication on one side of the building was good, while on other side attempts of communication failed.
Now with GLAMOS you can document blind spots and be ready to improve network setup if needed.
If your customers will need to deploy some sensors in this area, they won’t be surprised, but prepared.
Buildings will affect your signal quality – know when and how
“Why is my wireless (LoRaWAN) signal quality bad even if distance is small???”
This is often asked question in LoRaWAN/LPWAN world and it is often followed by answers like “maybe geography, maybe buildings…”
Lots of “maybe“, but it is hard to explain to someone easily and to visualize that.
With Line-of-Sight tool choose source location and receiver location, adjust heights and see through which buildings your RF signal will propagate.
See which buildings will affect your signal quality and can you maybe somehow avoid that obstructions.
Different styles for complete insight
With just one click get coverage heatmap for your LoRaWAN network. Colors of hexagons represent the best RSSI generated from that area. Red color hex represent perfect signal quality, blue means bad signal quality in that area.
Based on created heatmap:
- understand what are weak points of your network
- show your potential customers how good network and service you can offer. Convince them that you offer real LoRaWAN coverage, and not just simulated.
- plan future deployments
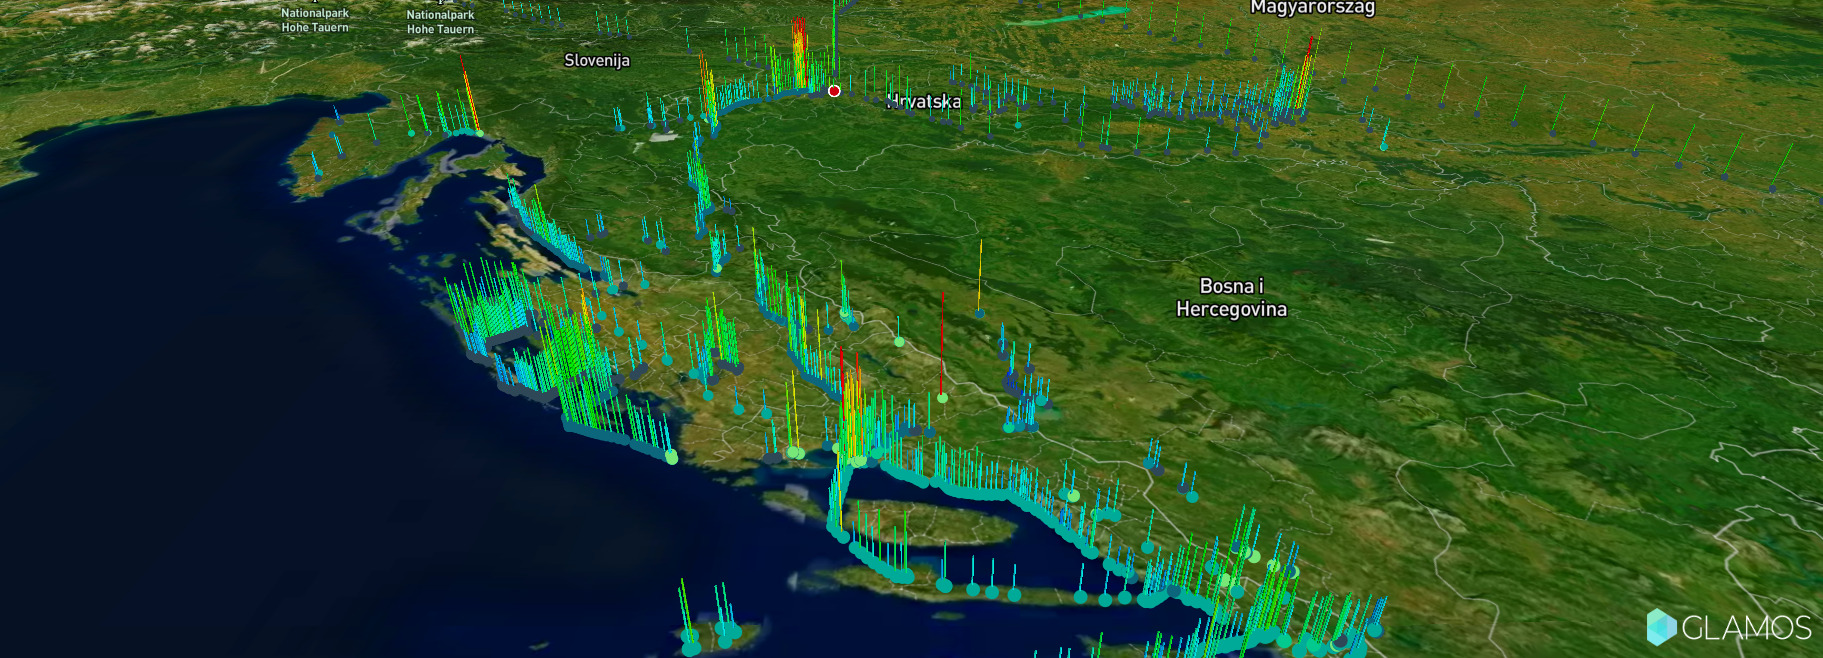
3rd dimension of coverage heatmap hexagon, height of column, represents measured LoRaWAN signal strength.
You don’t need to compare shades of color.
Just compare height of columns and understand better what location has better signal quality. Higher column – better signal – better performance.
Map has different layer views:
- 3D buildings – enables fully 3D visualization of urban area. See how buildings will affect communication
- 3D terrain – great overview of geography
- Satellite – see colorized photo of area
- Outdoor – visual of elevation in nature
- Light – standard view of streets and roads


Analytics tool
Lot of numbers can be confusing. Our Analytics tools help understand them well
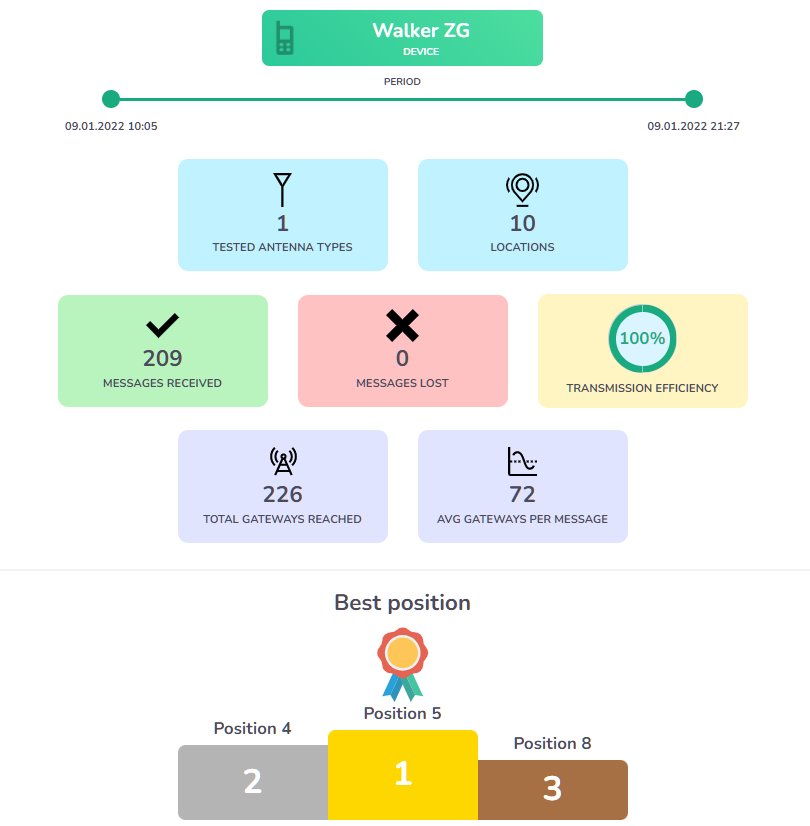
Location and antenna testing
Perfect for finding best location and antenna for sensor device or gateway (Helium hotspot) deployment. Quick test and detailed results
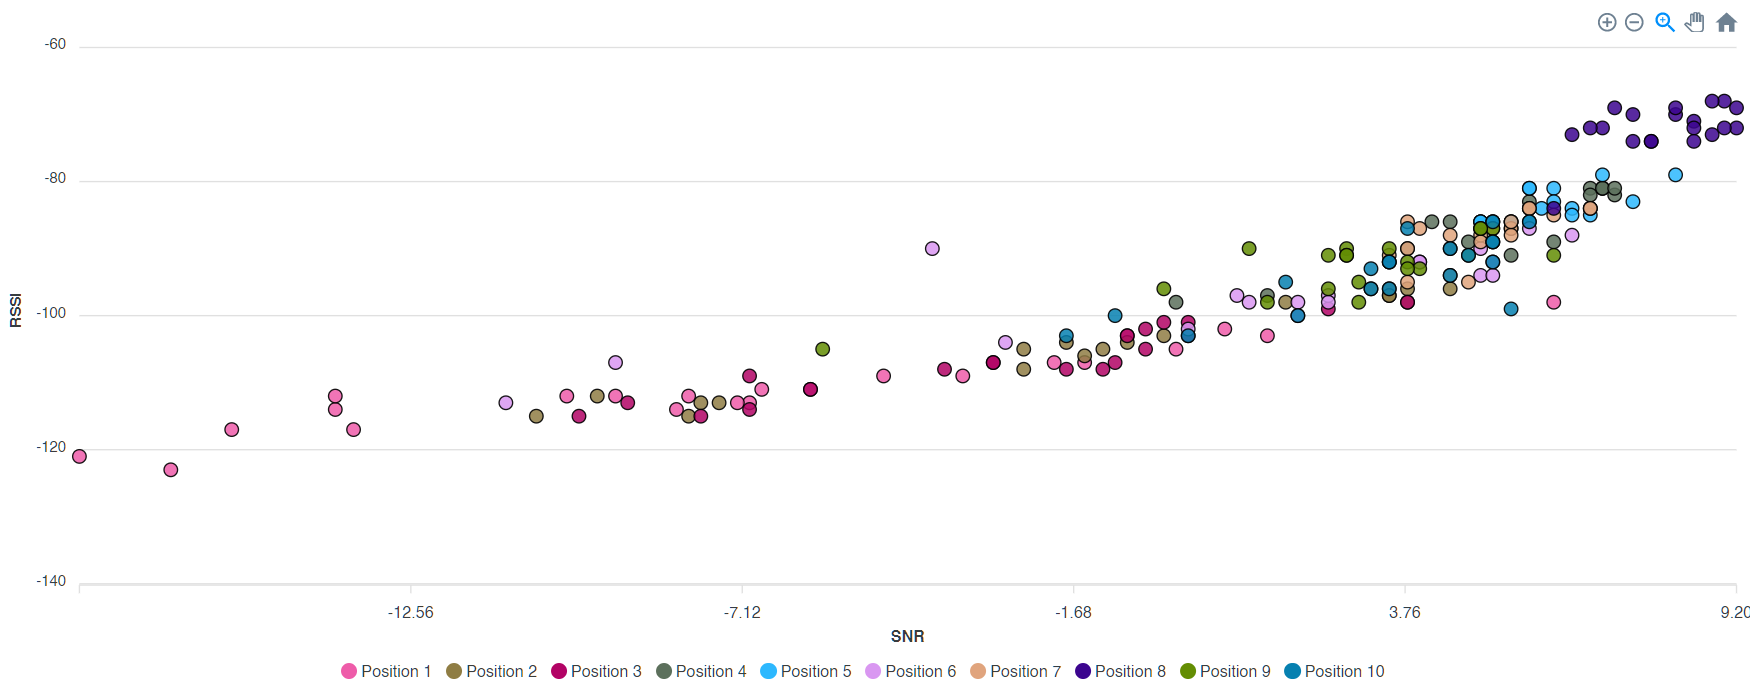
Generate reports
Walk App generates overview of analytics, but it can be exported to PDF with all details.
Comparison graphs for RSSI and SNR, special tables with comparison of 15+ parameters, mathematical algorithms
Coverage mapping
Field testing is sometimes just walking or driving around, but with Walk App reconstruct testing in virtual enviroment and generate video animation.
Analyze gateway
In LoRaWAN networks gateways are central point, the most important. Analytics tool helps you to understand how every specific gateway performs, what area it is covering and with what signal quality


Indoor mapping - first in the LoRaWAN world


Lots of use cases, but lot of dangers
Smart offices, watermeters or powermeters are just some of LoRaWAN use cases that are deployed indoor. But walls, glasses, shelves, doors and cabinets can destroy signal quality and kill battery fast.
Indoor mapping is important to:
- understand how good signal is
- how many gateways are accessible (redundancy)
- where is the best location to deploy sensors
Virtualize building easily
Walk App allows you to draw floorplan of your building fast. Or just import photo of floorplan (e.g. fire exit floorplan) and get floorplan of your building in app.
That is first step to completely visualize and virtualize your building – to create digital twin.
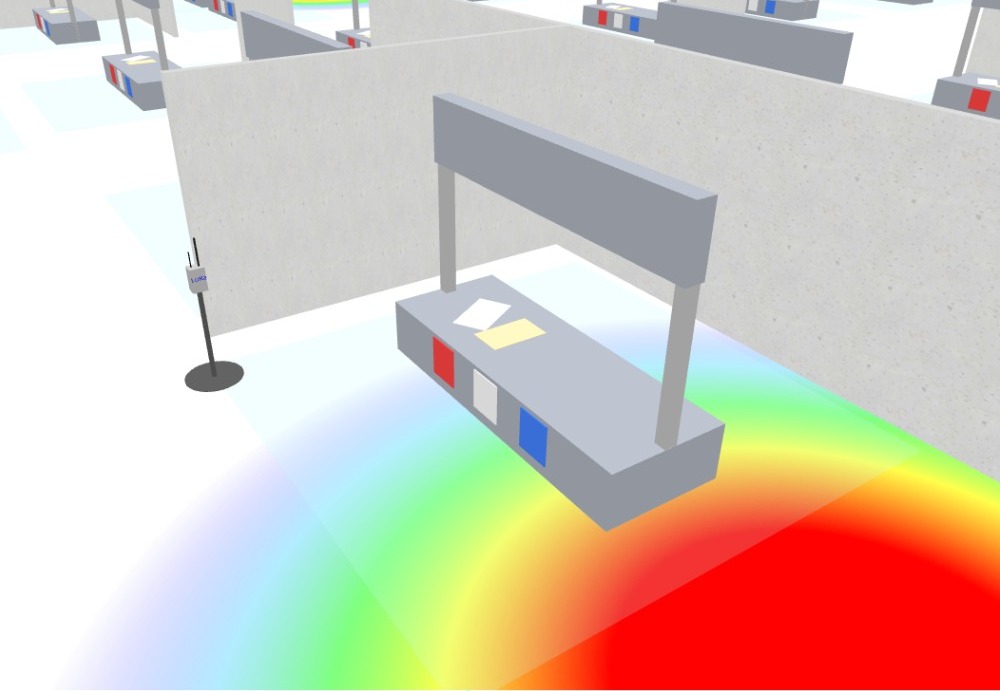
Wireless network visualized by colors
RF signals, electromagnetic waves, are not visible and people can feel it. Thanks to Walk App that is also available now.
Make real LoRaWAN testing and get heatmap which represents network quality. Compare different locations, heights and parameters to find setup for the best performance of your sensor.device.
Virtualize network in 3D enviroment
Get inside of your virtual 3D building and feel how each wall or other elements affect your sensor device or gateway deployment.