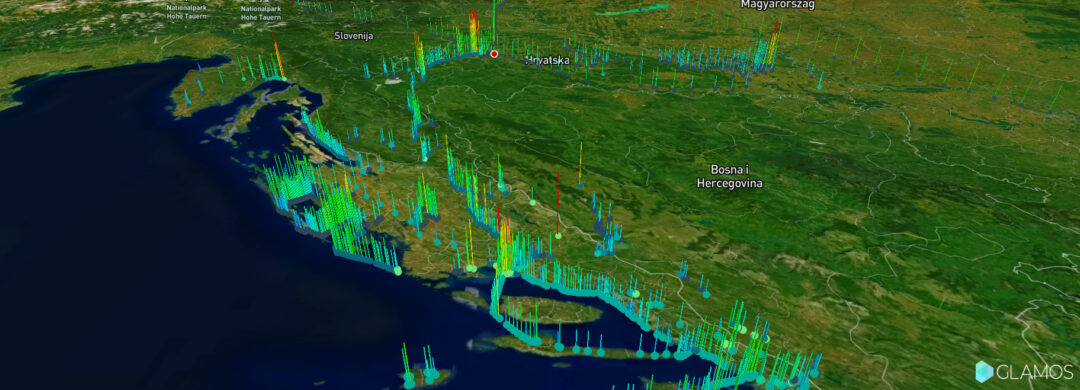
LoRaWAN 3D coverage heatmap
Numbers or colors?
People are primarily visual beings and register all information much easier that way.
Numbers and tables are not inborn to us, but a learned way to transfer information.
That is reason why GLAMOS Walk App has heatmaps (indoor and outdoor) to visualize data about LoRaWAN network and LoRaWAN signal quality. We can understand it better with colors. 🟥🟦🟩🟨
Using our Walker device or other LoRaWAN network tester (mapper) you can generate data, but Walk App will allow you to visualize it.
Some people (and especially men) find it difficult to distinguish shades of colors. Not sure if that is inborn. 😏 So, what if we add 3rd dimension to heatmap?
New feature
New feature of Walk App is 3D view of your LoRaWAN coverage mapping heatmap! 📊
3rd dimension, height of column, represents measured LoRaWAN signal strength.
Now you don’t need to compare shades of colors on heatmap.
Compare height of columns and understand better what location has better signal quality.
Higher column – better signal – better performance.
Know your wireless network better with GLAMOS! 📈
Start using Walk App here: https://app.glamos.eu
To display 3D heatmap go to Walk App Map and follow steps from image bellow.
To rotate map and change angle of map: 1. hold CTRL button on keyboard, 2. left click mouse, 3. move mouse.


